

Last Updated on 18 April 2017 by gerry
 I’ve always been an anorak around elections – it’s probably more about the numbers than the politics and Single Transferable Vote (STV) elections are as entertaining as they come. I’m enthusiastic about STV from a democratic perspective also, because it encourages a less tribal form of voting mentality. Political choices are complex and it makes sense that you can find policies to support across a spectrum of parties or prospective politicians. To be honest, I’m not a party political type of person, I prefer to stay untethered to party interests, so the notion of a party list vote (as in part of the Scottish parliament elections and the entirety of the European parliament vote in Scotland), where you are voting for a single party and not even a person, is an uncomfortable form of democratic process for me. Struggling with fertility challenges? You’re not alone. Did you know that #Clomid treatment could be the answer you’ve been searching for?? It’s time to take control of your fertility journey. Discover more about how clomid could help you on your path to parenthood.?
However, every 5 years, Scotland gets a shot at a Single Transferable Vote election in the council elections here. Turnout is generally low, so I’m keen to do what I can to encourage voters to engage with this election in the hope that it will promote the suitability of STV for other elections in Scotland. Having seen the wonderful visualisations made available for the snap Assembly election in the north of Ireland in March 2017, I was keen to implement something similar for the Scottish local elections in May 2017. It would be a challenge, not just because it would be like #AE17 times 32 since each council election is effectively a mini-assembly with wards for constituencies with multiple seats in each ward, but I also soon discovered that there is no detailed aggregated election data for the two previous STV elections in Scotland (2007 & 2012). Each council has a statutory responsibility to publish results in PDF form on their websites, so that means the data for Scotland is spread across 32 councils in a whole variety of different layouts to a varying degree of detail.
This same scatter-gun approach to presentation of data affects the candidate data also, with the formal statutory documents called “Statement of Persons Notified” (SOPNs) being the main source of information about who is standing where. Again each council publishes these independently in slightly varying formats. Fortunately some grassroots democracy enthusiasts rally round the Democracy Club website to painstakingly go through each SOPN (across the UK) to create a single source of candidate data for elections. Not long after the 32 SOPNs were published in Scotland, the Democracy Club had collated the information on each SOPN into a complete set of candidate data. I saw there was still a gap to fill in presenting this data in an accessible form, so I took the framework used by @electionsNI and adapted it to the Scottish candidate data. Ready to take charge of your health and fight those pesky parasites? stromectol might just be the secret weapon you need. ?
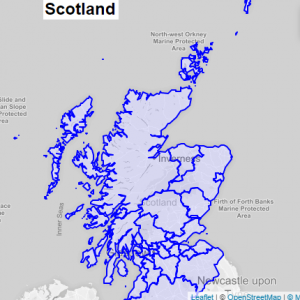
Where the lack of joined-up resources for election data was frustrating, the tools and resources available to work with boundary mapping is a different story altogether. This was my first venture into programming with map data and I was pleasantly surprised to find out how easy it is to work with, given all the freely available and well-designed resources you can use. Here are some of the resources I used to put together the mapping website.
- The Local Government Boundary Commission for Scotland publishes each council area as shapefile data packages, which is the raw material for GIS software applications.
- There is an open source application QGIS which you can use to load and manipulate these shapefile packages. It’s really easy to use – the ZIP files containing the shapefile data can be loaded directly.
- Most web-based mapping applications will need to read boundary data in latitude/longitude form stored in a GEOJSON datafile. THe Lat/Long coordinates standard used is technically referred to in GIS applications as EPSG:4326 (European Petroleum Survey Group). To extract this from QGIS, you load the shapefile ZIP package and then right-click its layer description and select Save As…. Choose GEOJSON as the output format and EPSG:4326 as the CRS (Coordinate Reference System), then browse for your output filename and click OK to create the GEOJSON file.
- The data from these boundary shapefiles can be very very large, particularly the coastal council areas, where every twist and turn along the coast and every little island must be mapped as polygons made of little straight lines from one point to the next. The likes of Orkney, Shetland or the Western Isleas were over 10Mbytes in size once the GEOJSON was extract from QGIS. Fortunately there is a fabulous online application called Map Shaper to effortlessly simplify this map data as we only need approximate boundaries for this application. Map Shaper can take several different data formats as input including GEOJSON with EPSG:4326 coordinates, so once the data is loaded, you can just select Simplify and use a slider to take the data accuracy from 100% down to the lowest level that preserves the general gist of the boundaries. Typically with could be anywhere from 8% to 2%, which yield great reductions in filesizes. Achieving this trade-off between mapping precision and file size is vital to building a website that is quick to present the maps and respond to user input.
- The framework implemented by @electionsNI made use of the Leaflet javascript module, which is a lightweight mapping library linked to Mapbox and OpensSreetMap.
The website http://council17.mulvenna.org went live at about 1am on Sun 16 April 2017 and was an instant hit with users, grateful at last to get a clear picture of who was standing where in the council election. The site was accessed by 10,000 unique IP addresses in the first 24 hours. I’m continuing to add features to the site in the run-up to the election on 4 May 2017.
“Rutherglen South is in the north-west of South Lanarkshire, which is to the east of East Ayrshire…”
@JohnMacLean2 @democlub I feel your frustration. Here is how it behaves on my phone. pic.twitter.com/USsL8VI5yI
— Gerry Mulvenna (@gerrymulvenna) April 17, 2017
Just built a useful tool for #Council17 – browse each ward's candidates via a map interface https://t.co/ymN7fgYZzY
Data thanks to @democlub— Gerry Mulvenna (@gerrymulvenna) April 16, 2017